In this post, I use Python to create an example of efficient frontier, build a web app by streamlit package, and host on pythonanywhere.
Main reference is here.
2022-11-18 and 11-19 updates:
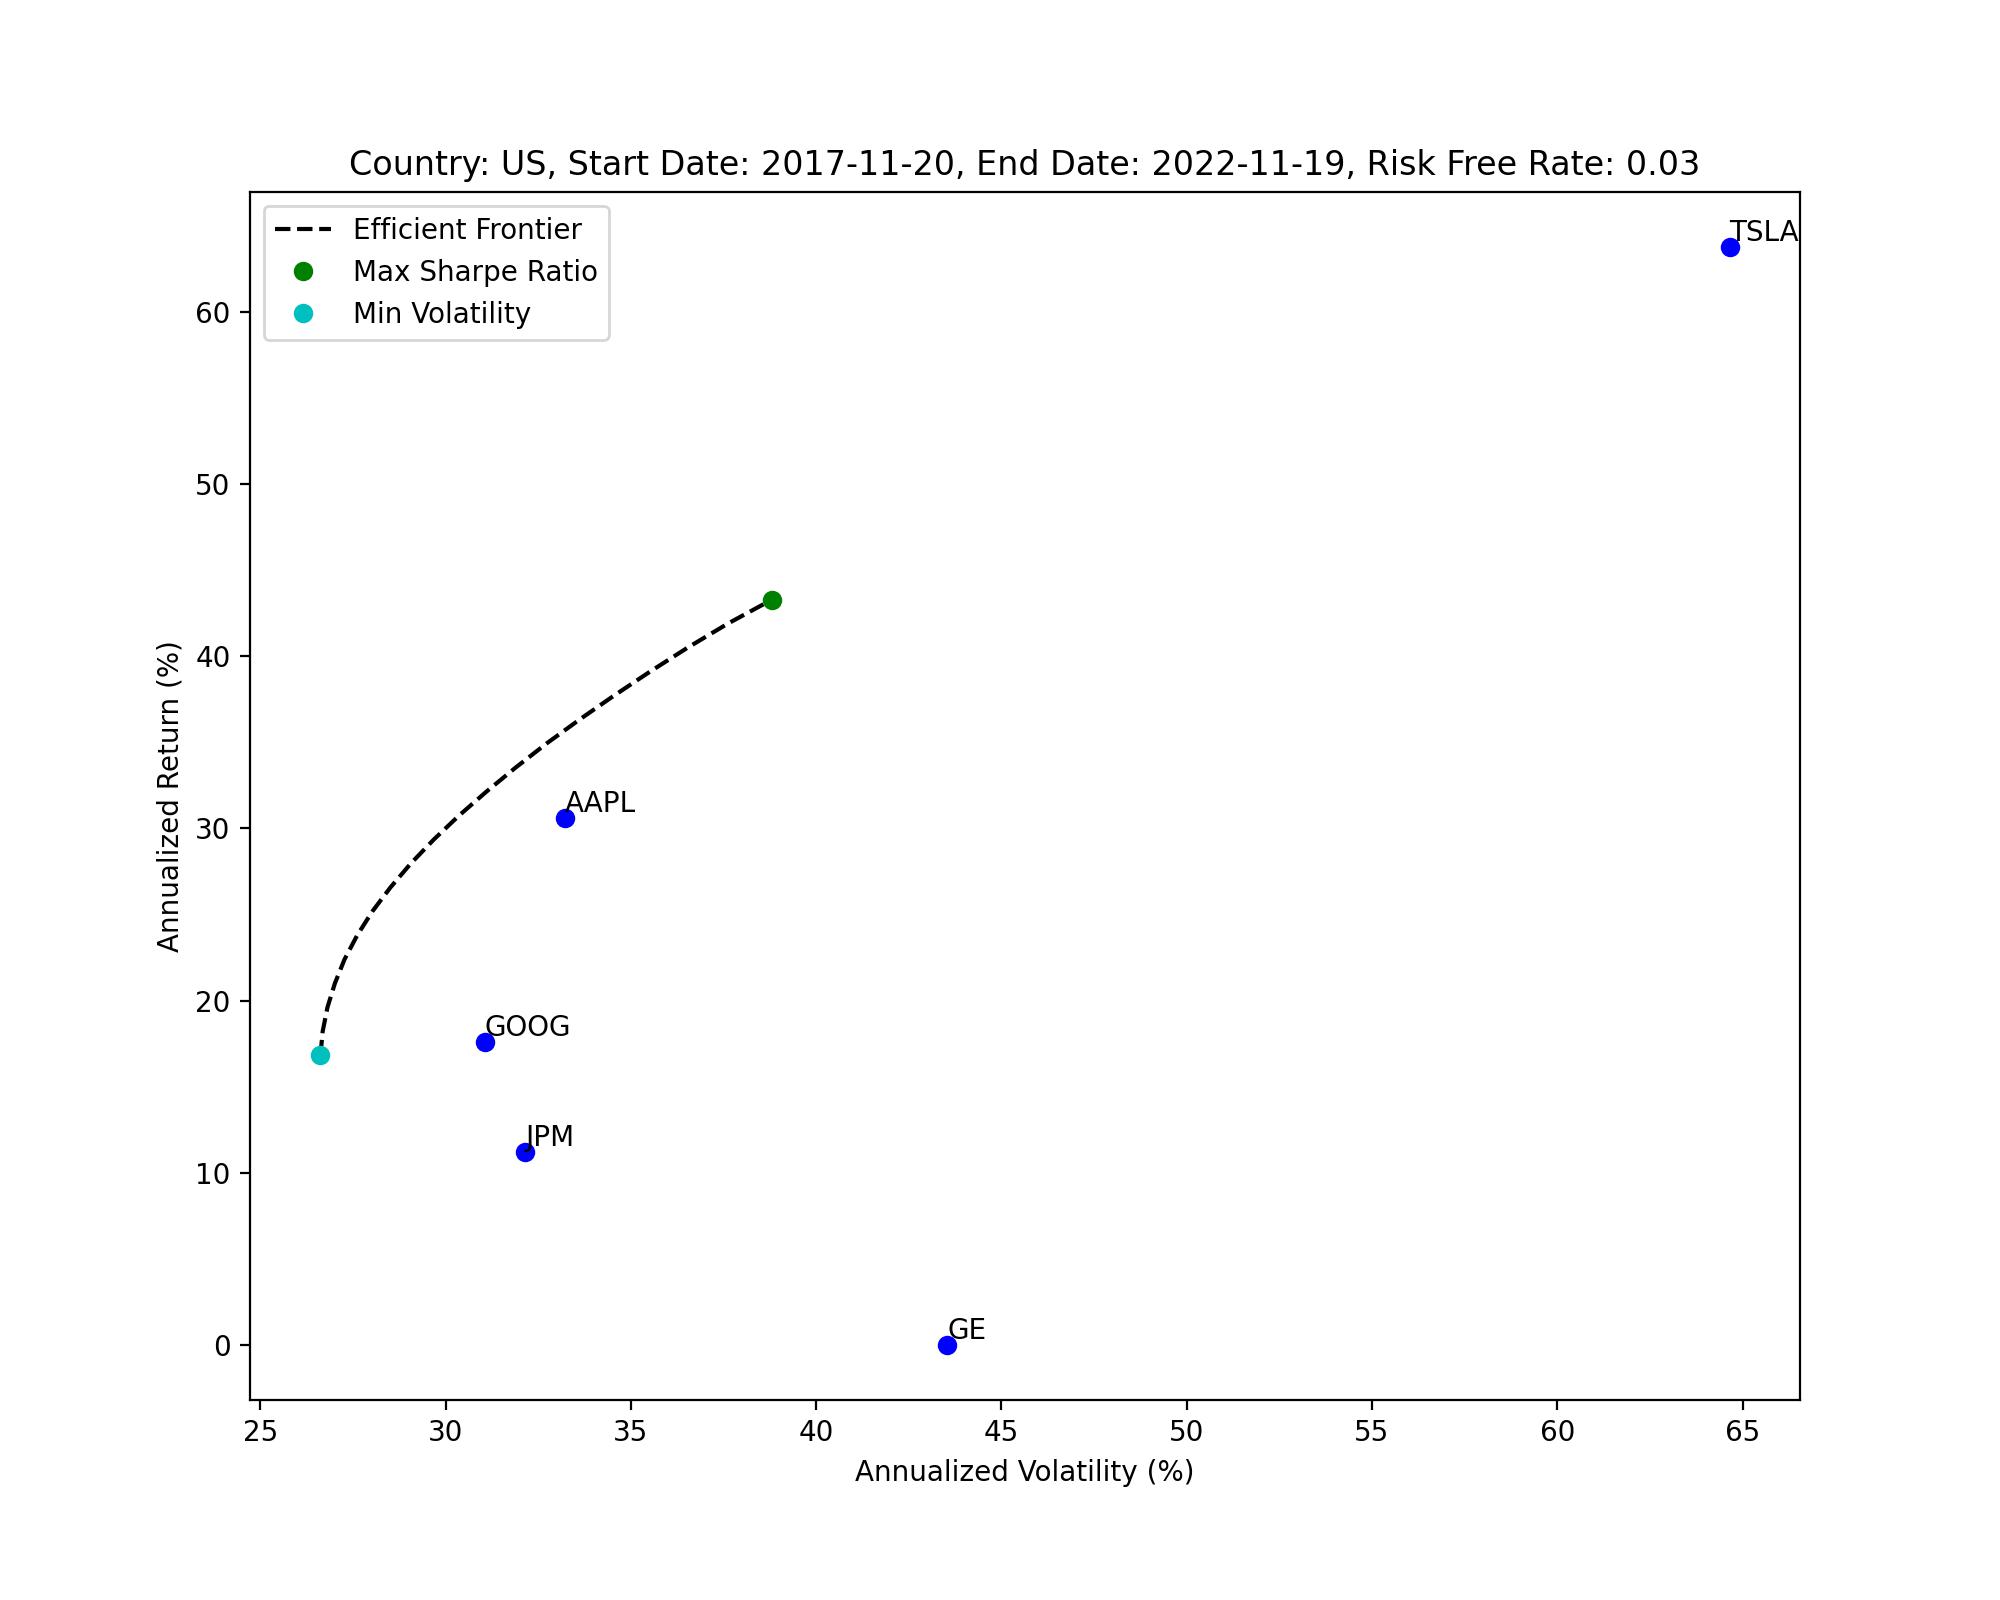
Results of US stock market:
Background information
| Start Date | End Date | Risk Free Rate |
|---|---|---|
| 2017-11-20 | 2022-11-19 | 0.03 |
Portfolio information
| Portfolio | Sharpe Ratio | Returns (%) | Volatility (%) |
|---|---|---|---|
| Max SR | 1.11546 | 43.28 | 38.8 |
| Min Vol | 0.632231 | 16.83 | 26.62 |
Composition details
| Portfolio Composition (%) | GE | JPM | GOOG | AAPL | TSLA |
|---|---|---|---|---|---|
| Max SR | 0 | 0 | 0 | 62 | 38 |
| Min Vol | 7 | 35 | 36 | 21 | 0 |
Efficient frontier plot
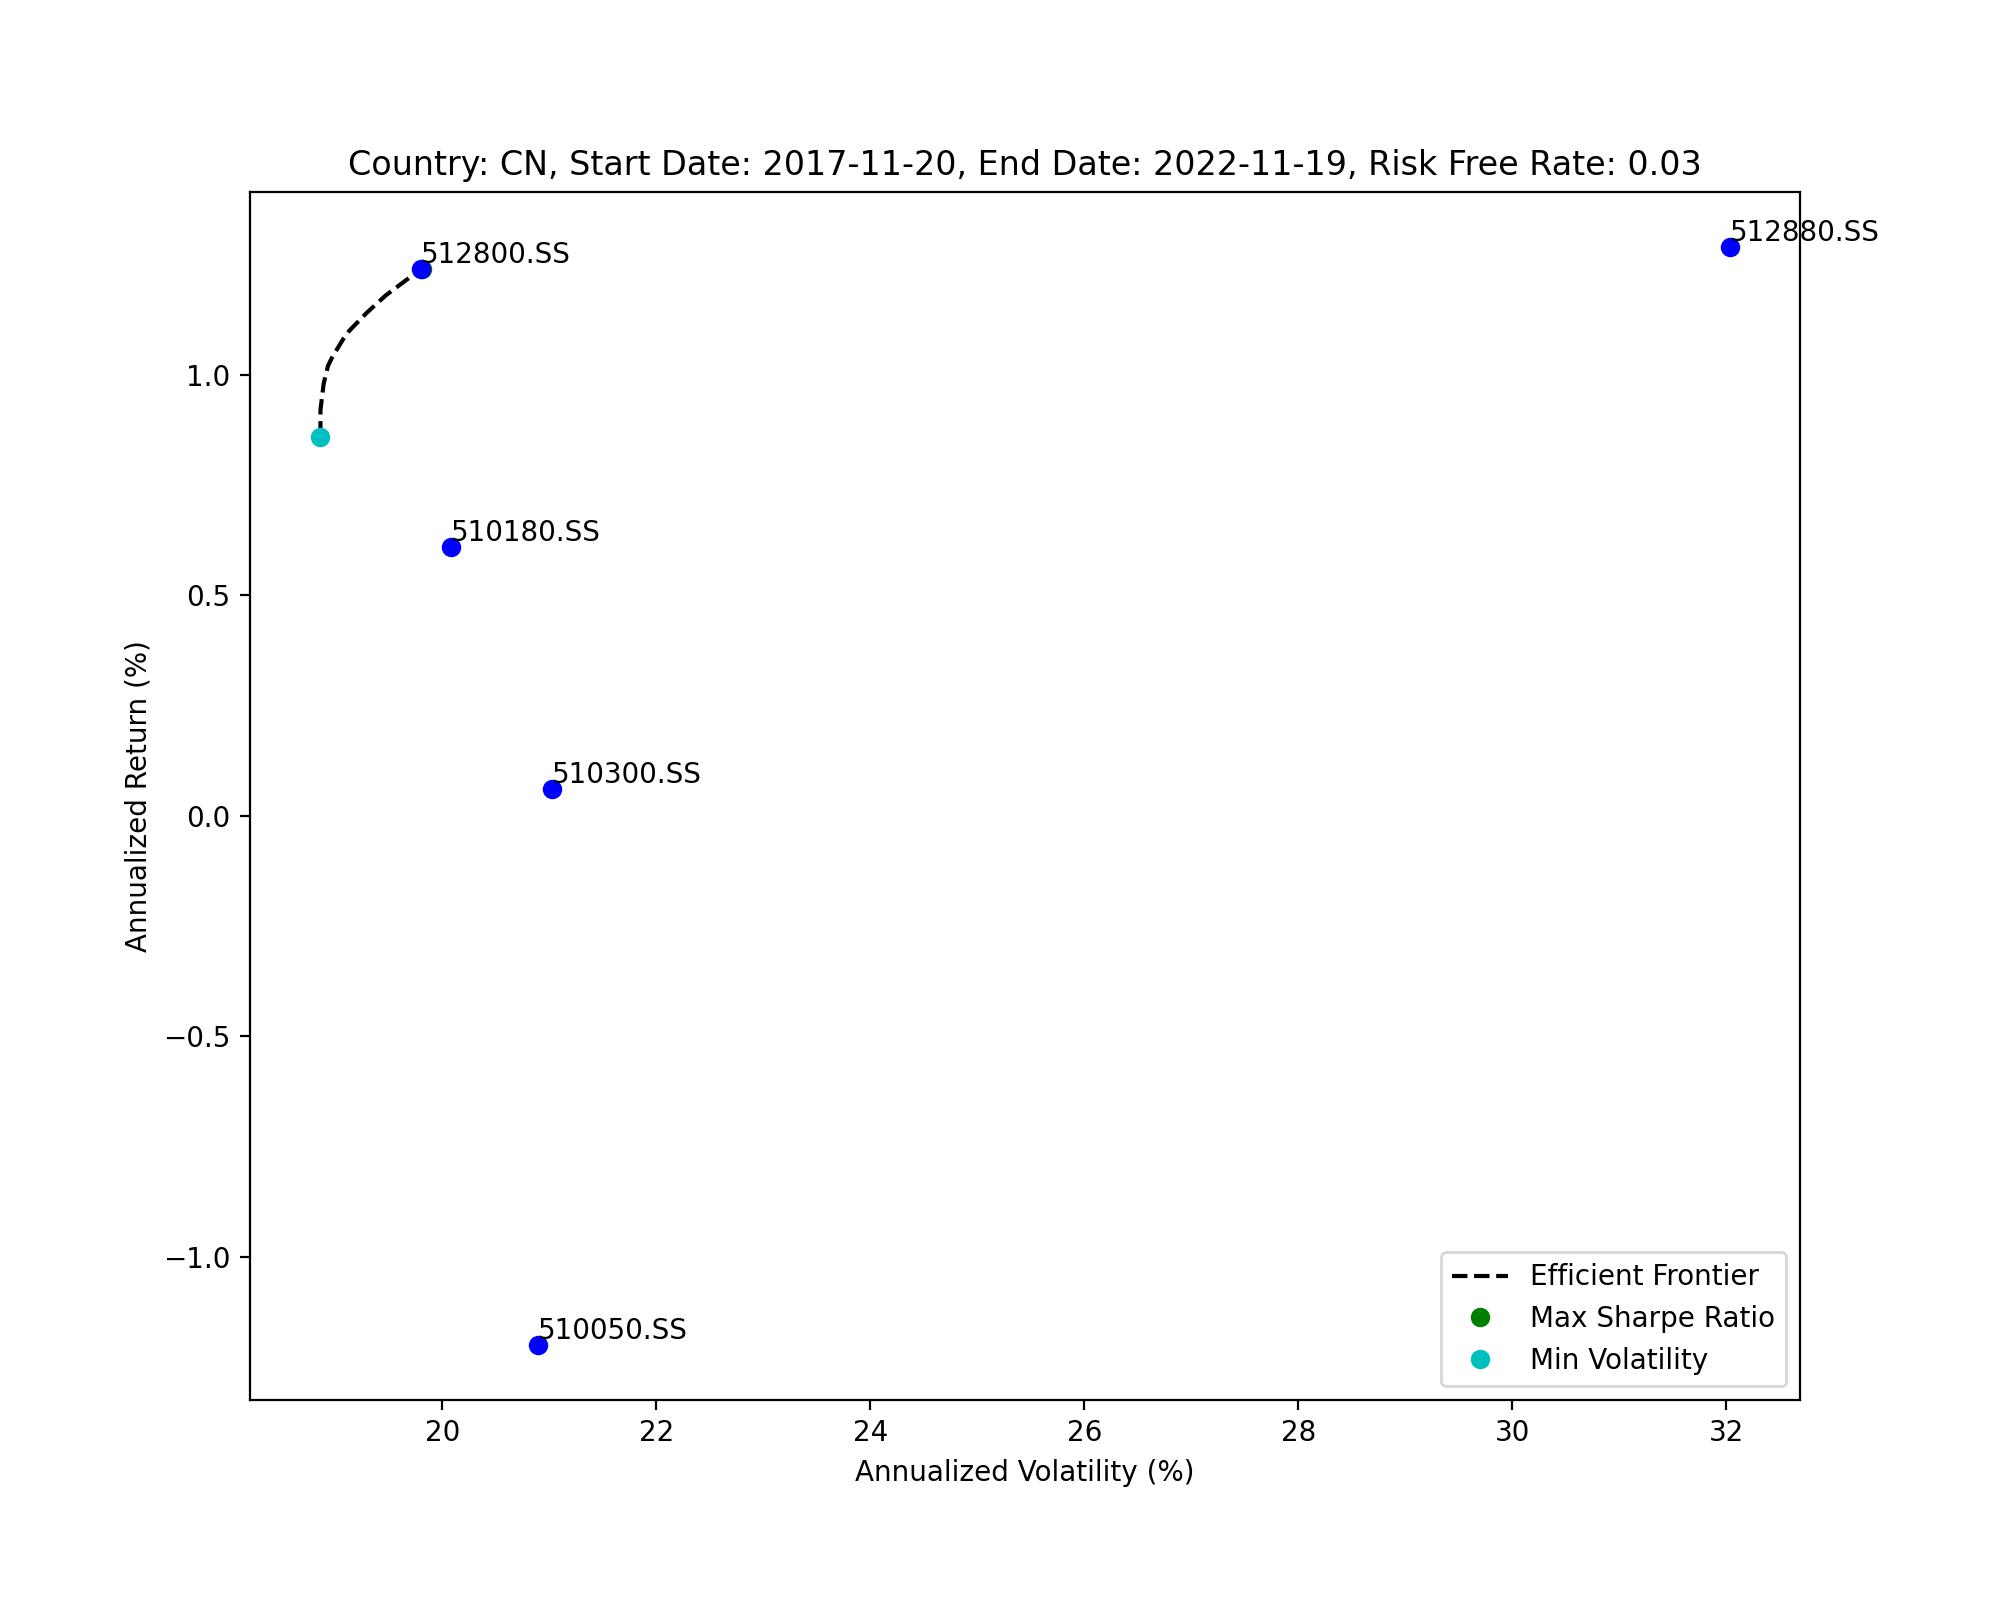
Results of CN stock market:
Background information
| Start Date | End Date | Risk Free Rate |
|---|---|---|
| 2017-11-20 | 2022-11-19 | 0.03 |
Portfolio information
| Portfolio | Sharpe Ratio | Returns (%) | Volatility (%) |
|---|---|---|---|
| Max SR | 0.0625946 | 1.24 | 19.81 |
| Min Vol | 0.0455992 | 0.86 | 18.86 |
Composition details
| Portfolio Composition (%) | 510050.SS | 510300.SS | 510180.SS | 512800.SS | 512880.SS |
|---|---|---|---|---|---|
| Max SR | 0 | 0 | 0 | 98 | 2 |
| Min Vol | 0 | 19 | 26 | 56 | 0 |
Efficient frontier plot
Some notes:
- Return: percentage change of stock price;
- Volatility: standard deviation of return;
- Sharpe ratio = Return/Volatility;
- For coding details, see this github post.