In this post, I apply the efficient frontier calculation to tradable funds in Shanghai and Shenzhen stock exchange.
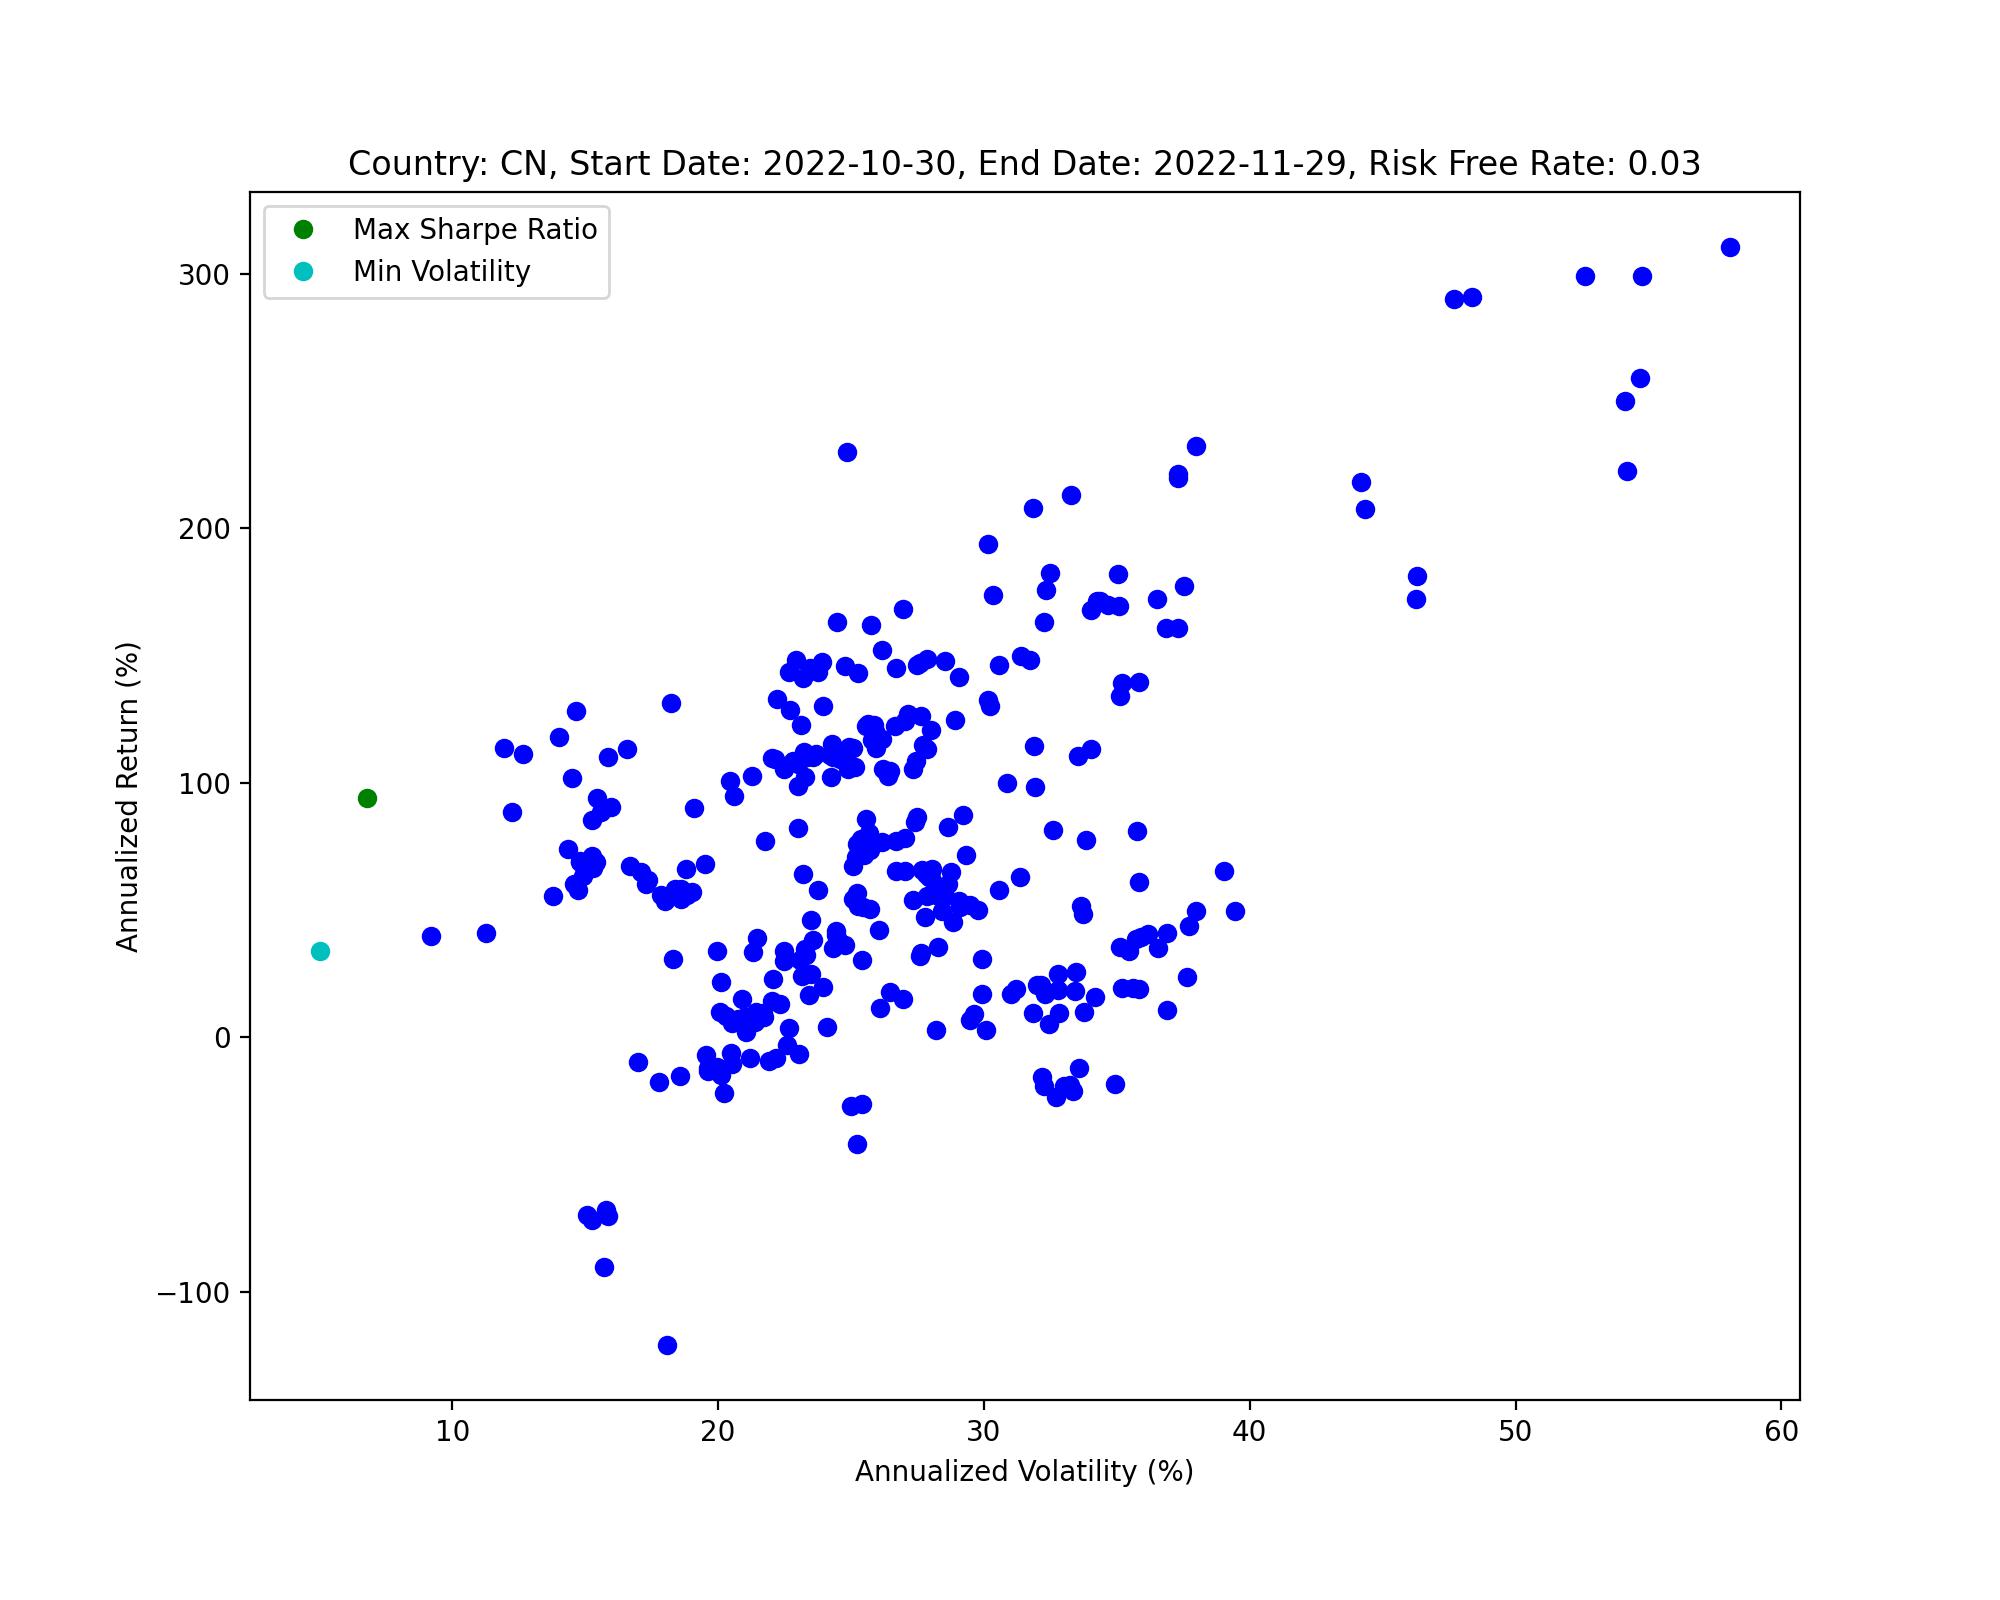
Today’s Updates 2022-11-30
- Assume we have 10,000 in total, I list the shares to buy for each fund below.
- 假设我们总共有10,000资金,每只基金的购买份数如下表。
| Portfolio Shares | 512980.SS | 515450.SS | 516310.SS | 516950.SS | 516970.SS | 561700.SS | 562390.SS | 518800.SS |
|---|---|---|---|---|---|---|---|---|
| Max SR | 681 | 1402 | 117 | 100 | 349 | 3478 | 1129 | 667 |
Other Information
| Start Date | End Date | Risk Free Rate |
|---|---|---|
| 2022-10-30 | 2022-11-29 | 0.03 |
| Portfolio | Sharpe Ratio | Returns (%) | Volatility (%) |
|---|---|---|---|
| Max SR | 13.8147 | 93.94 | 6.8 |
| Min Vol | 6.7004 | 33.77 | 5.04 |
| Portfolio Composition (%) | 512980.SS | 515450.SS | 516310.SS | 516950.SS | 516970.SS | 561700.SS | 562390.SS | 518800.SS |
|---|---|---|---|---|---|---|---|---|
| Max SR | 4 | 17 | 1 | 1 | 4 | 33 | 13 | 26 |
| Portfolio Composition (%) | 512670.SS | 515450.SS | 516670.SS | 516760.SS | 561700.SS | 562390.SS | 518800.SS | 159883.SZ |
|---|---|---|---|---|---|---|---|---|
| Min Vol | 13 | 13 | 5 | 2 | 10 | 2 | 45 | 10 |

2022-11-22 Updates
Exclude Funds with Low Volume:
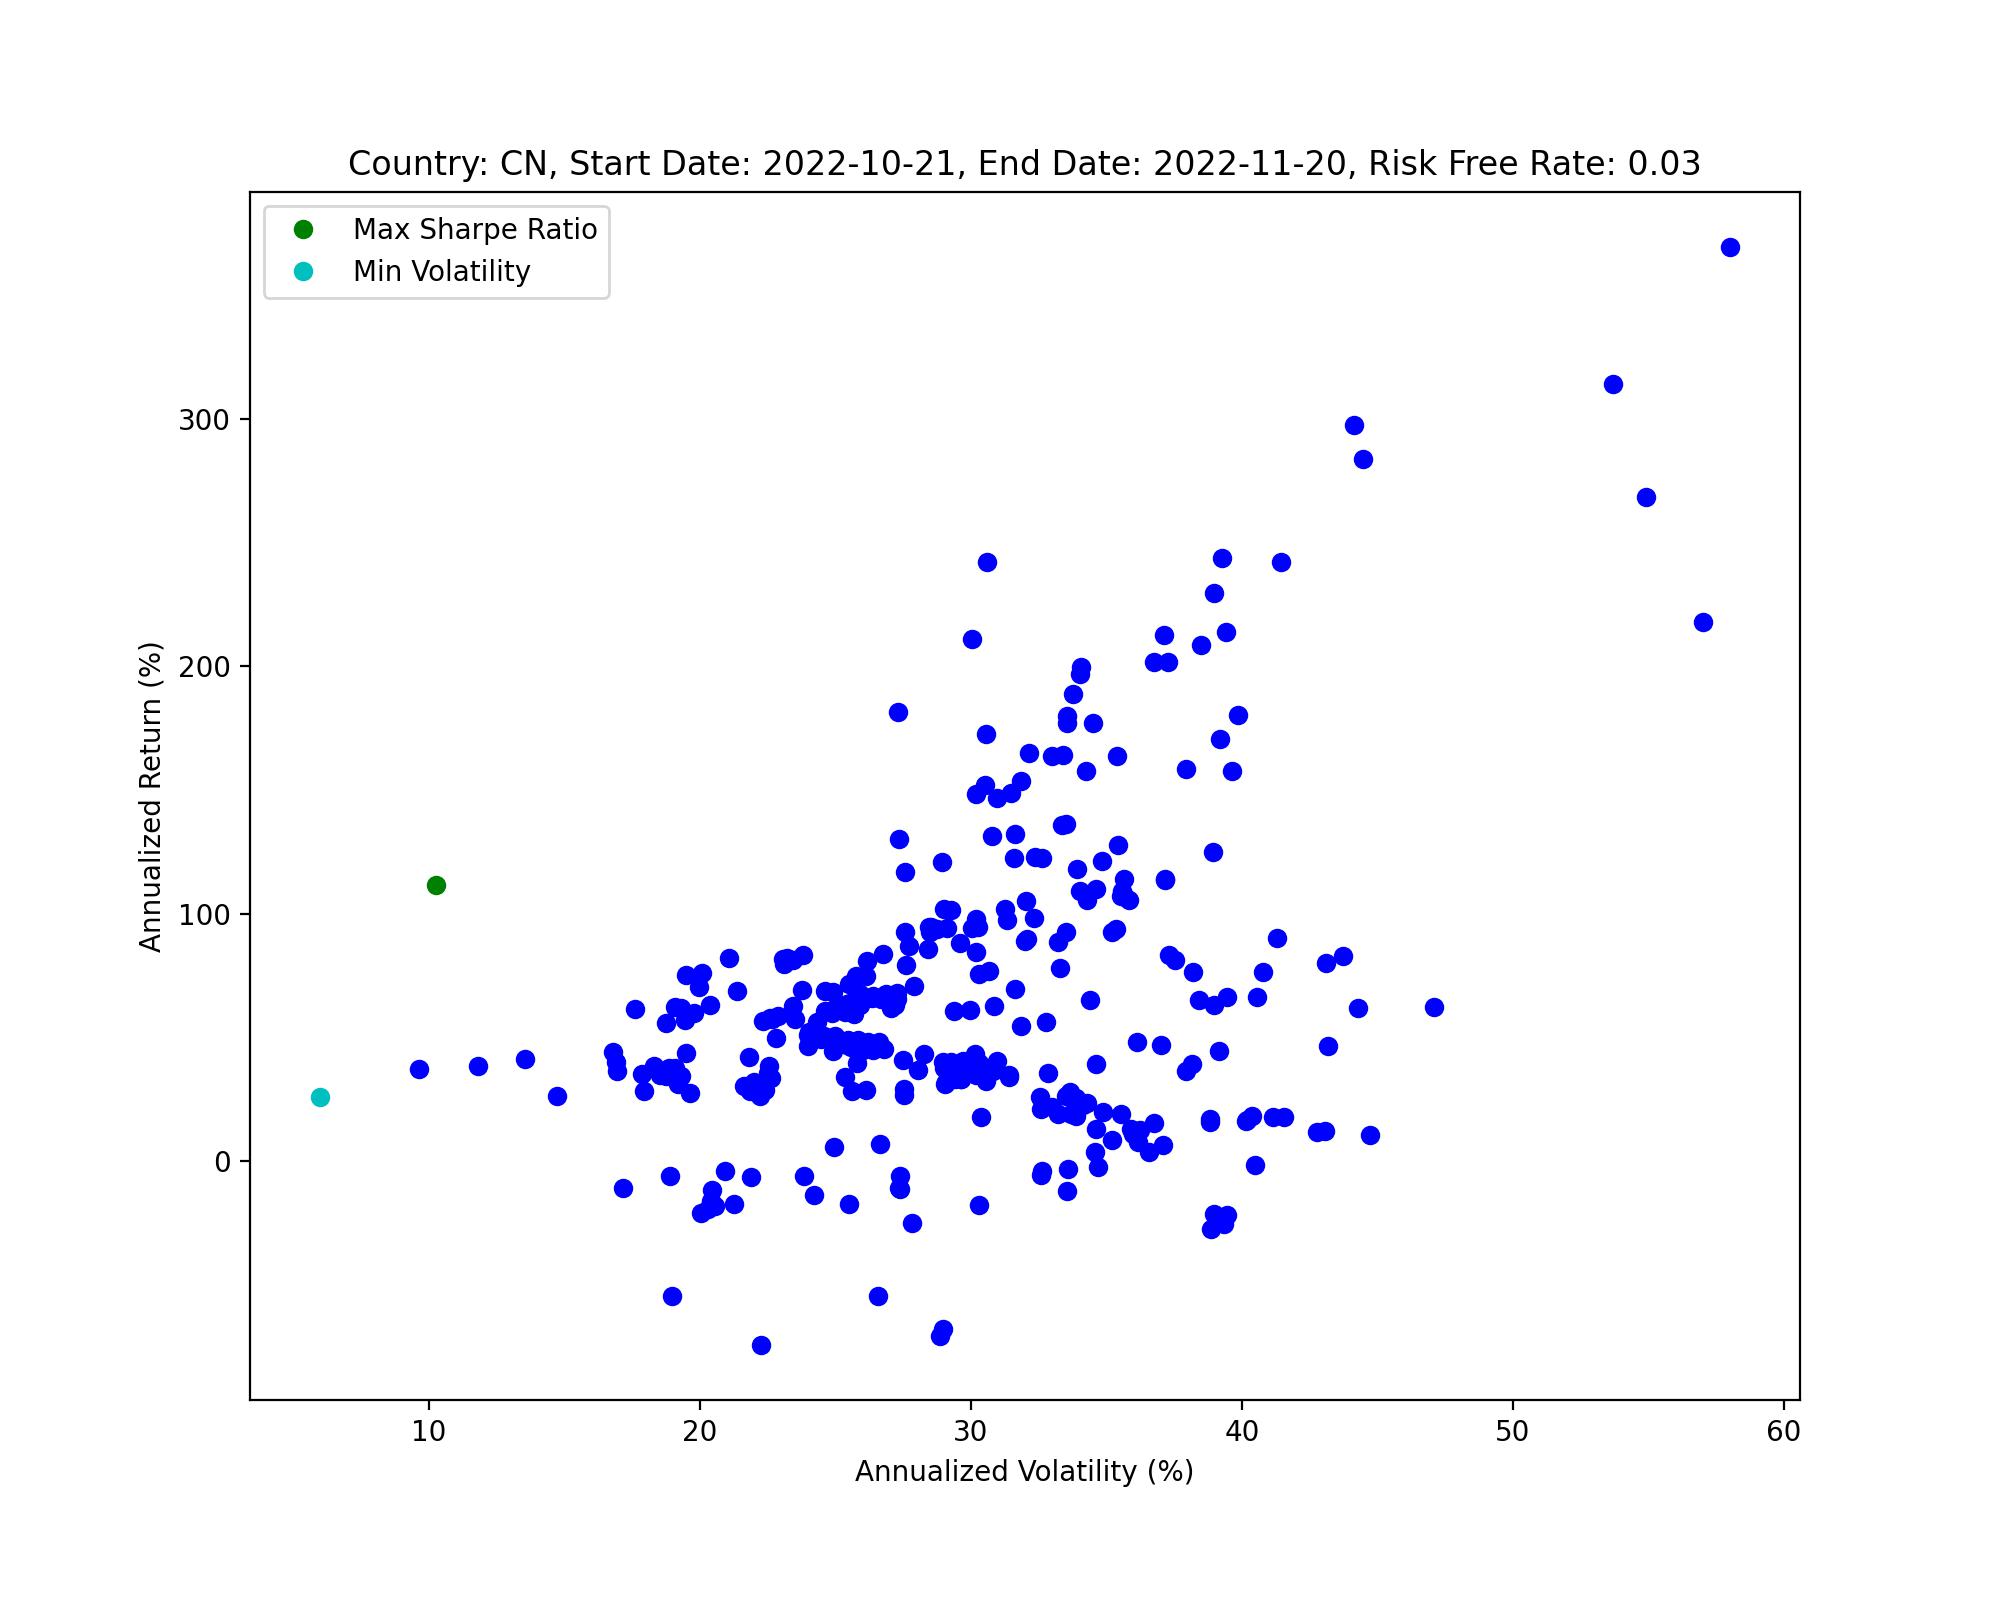
- We exclude ETFs with average volume lower than 10,000,000, and only 324 funds left;
-
Assume we have 10,000 in total, I list the shares to buy for each fund below.
- 我们排除了平均交易量低于10,000,000的ETF,过滤后剩余324只基金;
- 假设我们总共有10,000资金,每只基金的购买份数如下表。
| Portfolio Shares | 517380.SS | 561510.SS | 518800.SS | 159718.SZ | 159738.SZ |
|---|---|---|---|---|---|
| Max SR | 1273 | 726 | 1645 | 828 | 1327 |
Other Information
| Start Date | End Date | Risk Free Rate |
|---|---|---|
| 2022-10-21 | 2022-11-20 | 0.03 |
| Portfolio | Sharpe Ratio | Returns (%) | Volatility (%) |
|---|---|---|---|
| Max SR | 10.8716 | 111.76 | 10.28 |
| Min Vol | 4.34333 | 26.06 | 6 |
| Portfolio Composition (%) | 517380.SS | 561510.SS | 518800.SS | 159718.SZ | 159738.SZ |
|---|---|---|---|---|---|
| Max SR | 9 | 9 | 64 | 7 | 11 |
| Portfolio Composition (%) | 512670.SS | 516310.SS | 588150.SS | 518800.SS | 159867.SZ | 159898.SZ |
|---|---|---|---|---|---|---|
| Min Vol | 12 | 13 | 8 | 56 | 2 | 8 |

Without ETFs based on Foreign Assets:
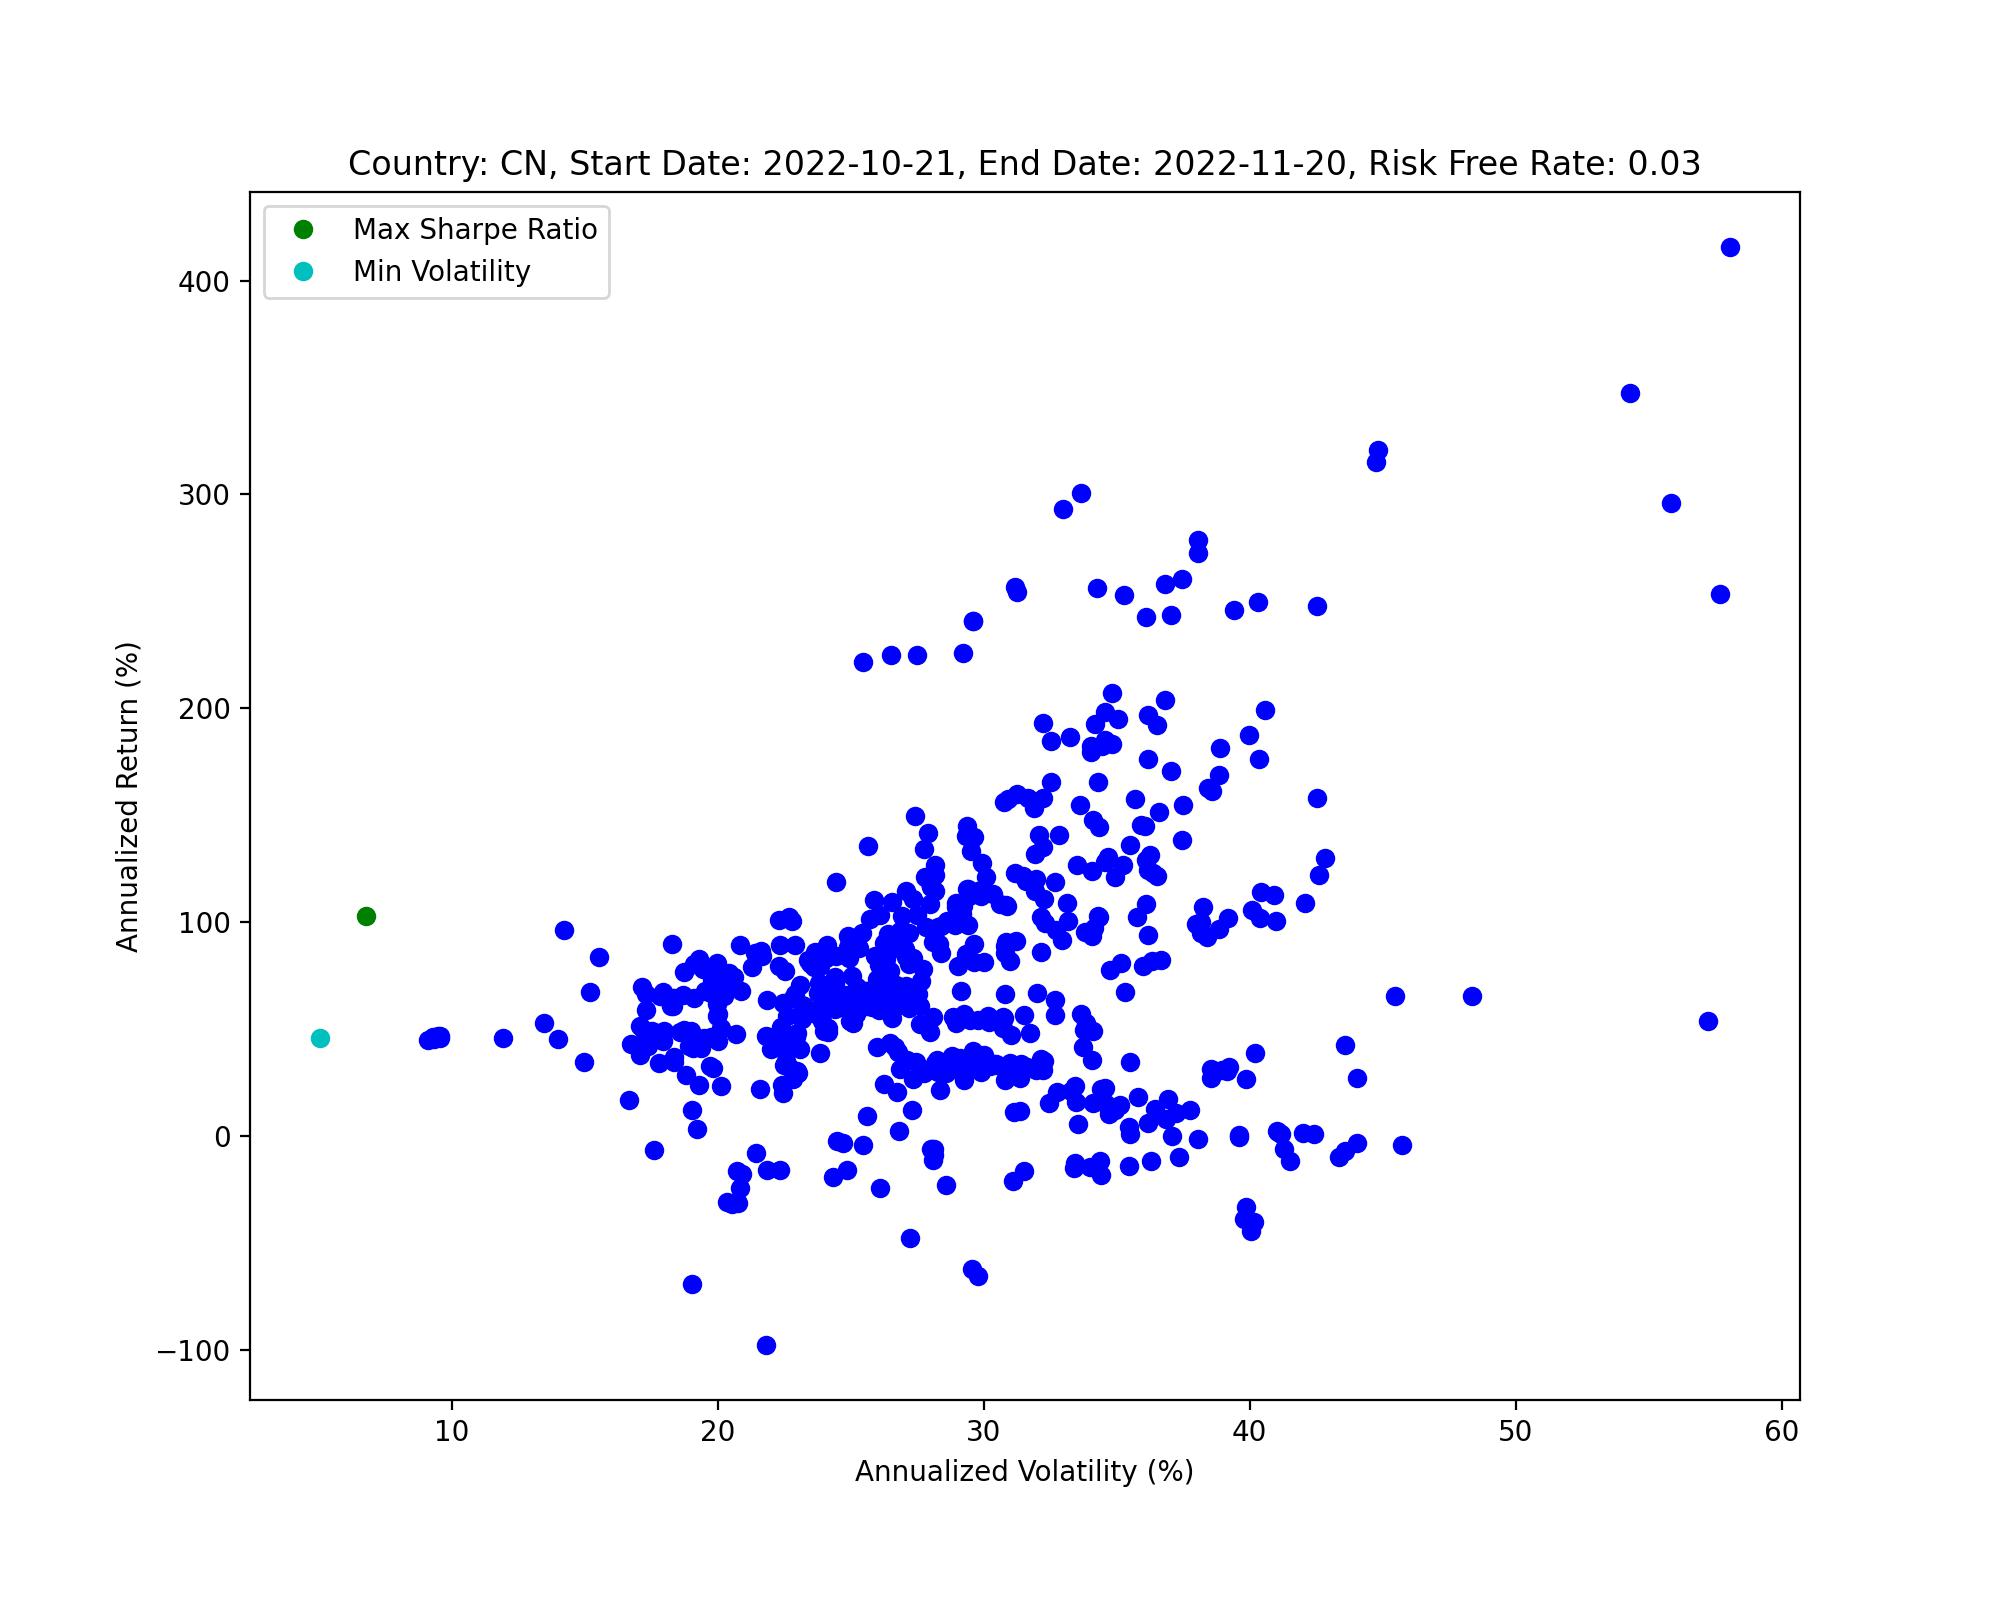
去除以外国资产为标的物得ETF,结果如下:
Background information
| Start Date | End Date | Risk Free Rate |
|---|---|---|
| 2022-10-21 | 2022-11-20 | 0.03 |
Portfolio information
| Portfolio | Sharpe Ratio | Returns (%) | Volatility (%) |
|---|---|---|---|
| Max SR | 15.21 | 102.96 | 6.77 |
| Min Vol | 9.08 | 46.02 | 5.07 |
Composition details
| Portfolio Composition (%) | 510270.SS | 510770.SS | 512190.SS | 515190.SS | 516190.SS | 516770.SS | 562390.SS | 518680.SS | 518890.SS | 159738.SZ |
|---|---|---|---|---|---|---|---|---|---|---|
| Max SR | 8 | 1 | 14 | 12 | 2 | 2 | 10 | 36 | 2 | 13 |
| Portfolio Composition (%) | 510270.SS | 510770.SS | 512190.SS | 512670.SS | 515190.SS | 516100.SS | 562390.SS | 518600.SS | 518680.SS | 159883.SZ |
|---|---|---|---|---|---|---|---|---|---|---|
| Min Vol | 2 | 3 | 17 | 3 | 8 | 5 | 1 | 29 | 17 | 16 |
Return/Volatility scatter plot

Data Preparation
Data source
Data cleaning
- We exclude LOFs, REITs, and some of the ETFs of bonds.
- In total we have 674 funds left (431 from Shanghai, 243 from Shenzhen).
- On yahoo finance, we can only get data of 661 funds.
- 653 of them has return data with less than 3 missing data points.
-
Funds with missingness more than 3 are deleted, while others are dealt with mean imputation.
- 我们排除了LOFs、REITs和一些债券类的ETFs。
- 我们总共剩下674只基金(上海431只,深圳243只)。
- 在雅虎财金上,我们只能获取661只基金的数据。
- 其中653只的回报率数据缺失值少于3个。
- 缺失值数量超过3的基金被删除,而剩余缺失值则用均值填充。
Results Report
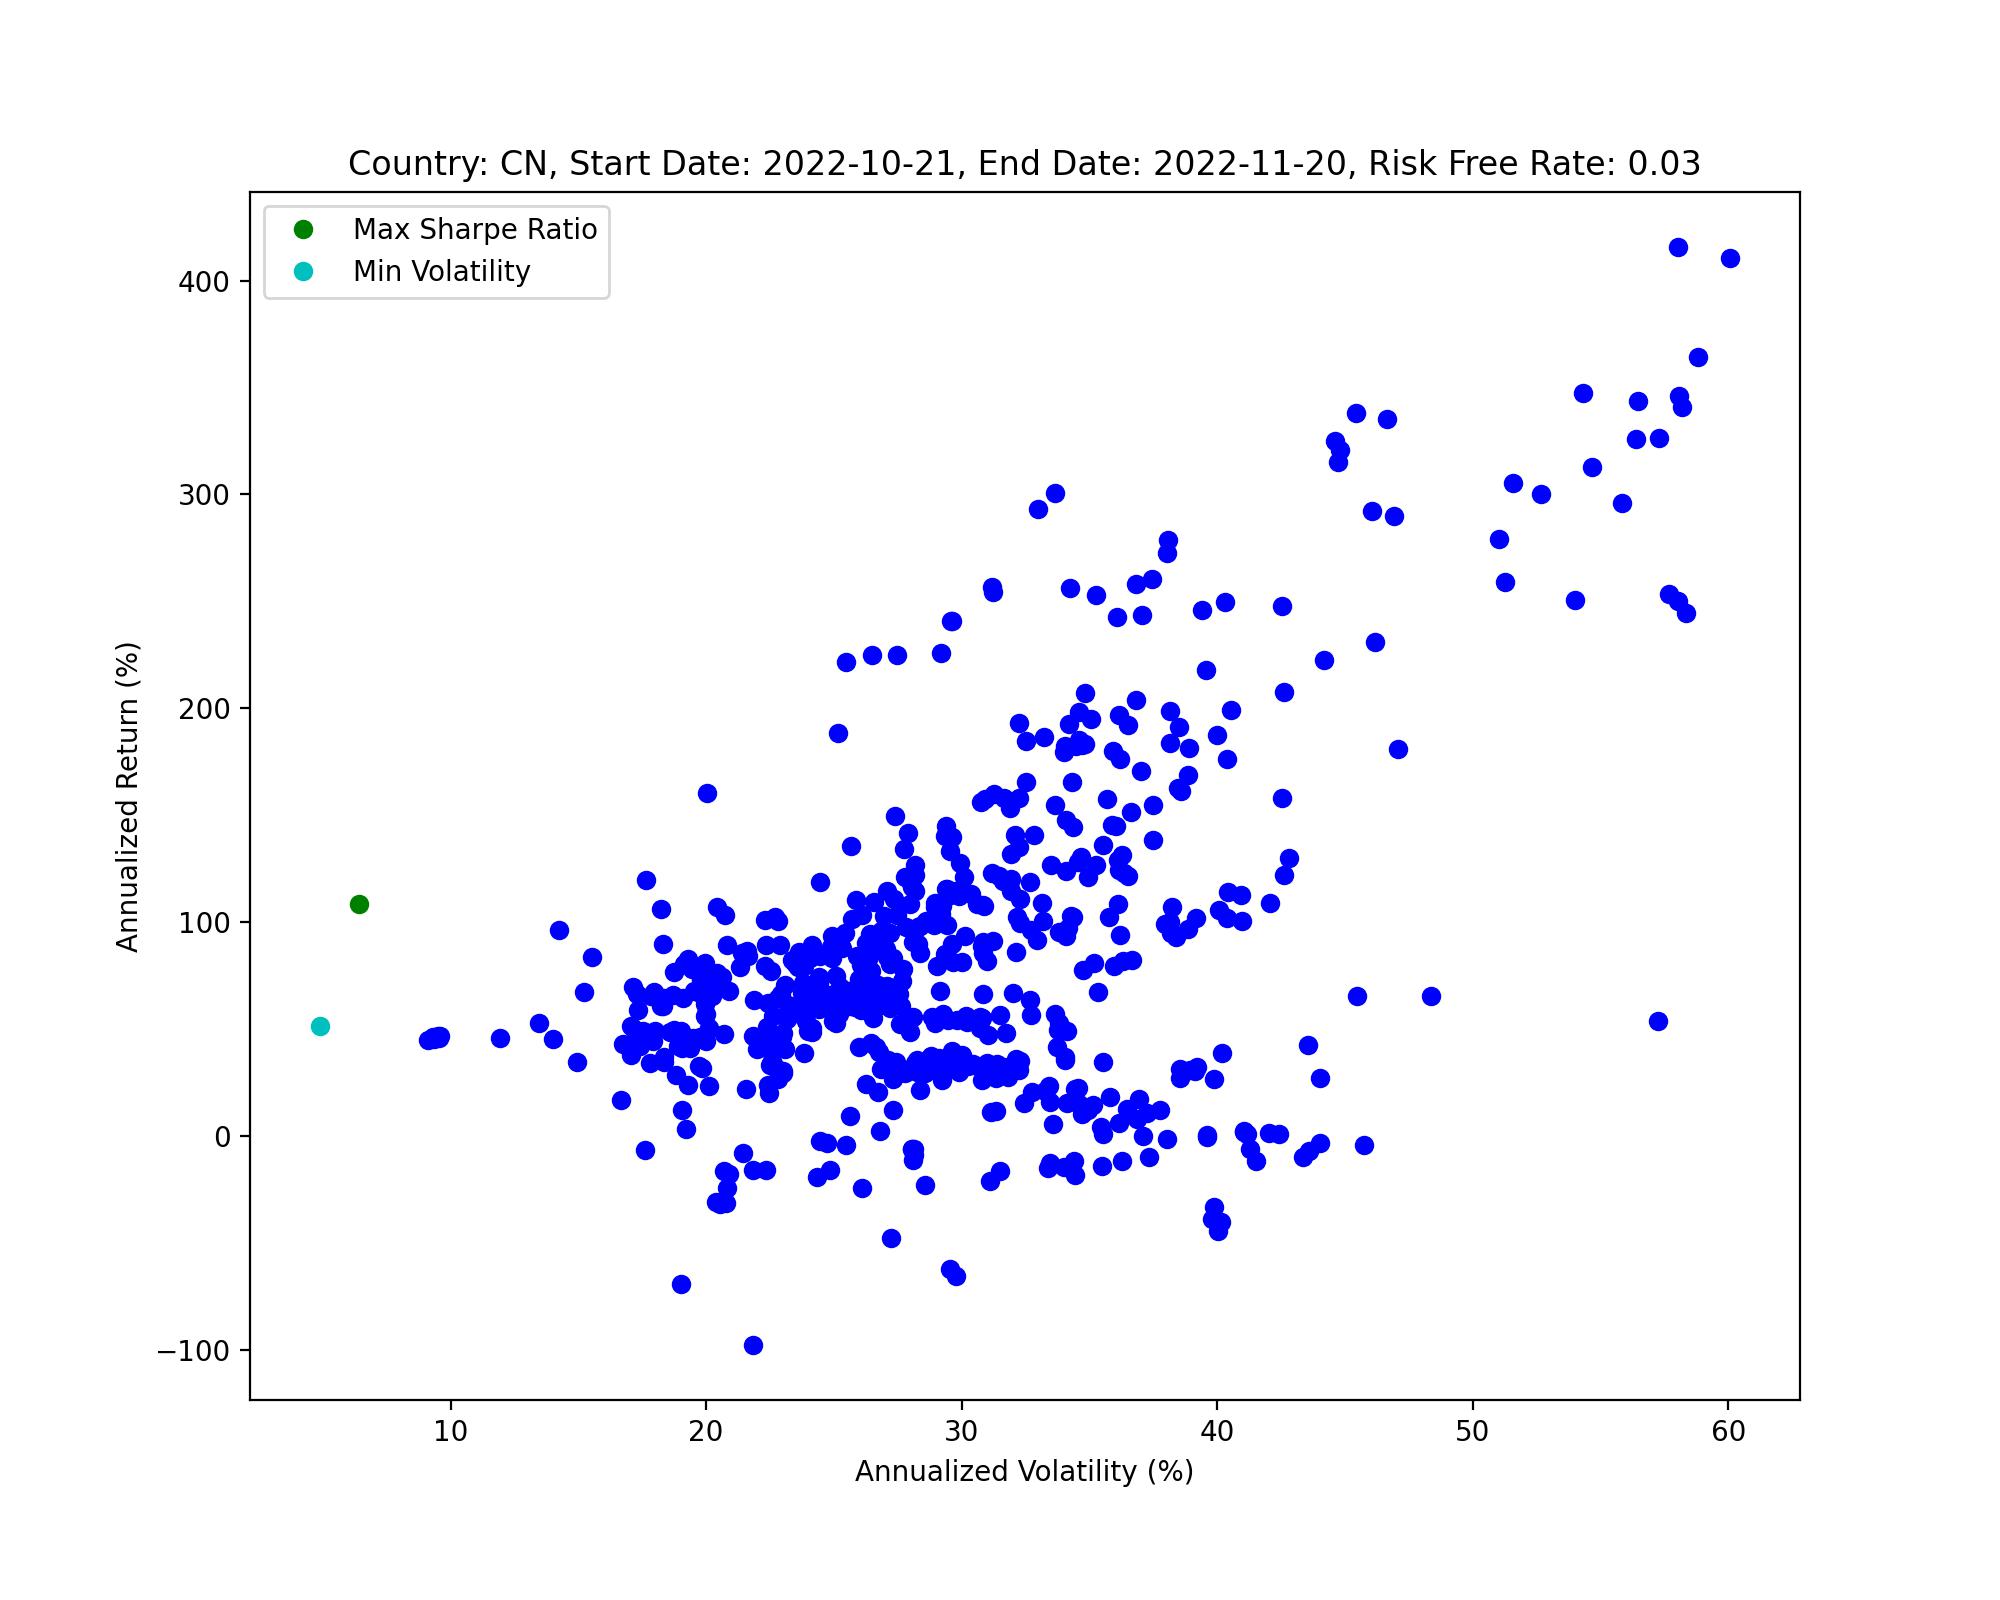
The portfolio that maximizes the Sharpe Ratio is consist of 10 funds (only these 10 have none zero weights after optimization), and the corresponding Sharpe Ratio is 16.90. For the portfolio that minimizes the Volatility is consist of 13 funds, and Sharpe Ratio is 10.47.
The fund with highest weight in both portfolio is 513800.SS (China Southern Summit TOPIX ETF(QDII)). For more information, please look at the tables below.
使夏普比率最大化的投资组合(Max SR)由10只基金组成(优化后只有这10只基金是非零权重),对应的夏普比率为16.90。而最小化波动率的投资组合(Min Vol),由13只基金组成,夏普比率为10.47。
两个投资组合中权重最高的基金是513800.SS(南方顶峰TOPIXETF(QDII))。更多信息,请见下表。
Background information
| Start Date | End Date | Risk Free Rate |
|---|---|---|
| 2022-10-21 | 2022-11-20 | 0.03 |
Portfolio information
| Portfolio | Sharpe Ratio | Returns (%) | Volatility (%) |
|---|---|---|---|
| Max SR | 16.90 | 108.67 | 6.43 |
| Min Vol | 10.47 | 51.41 | 4.91 |
Composition details
| Portfolio Composition (%) | 510270.SS | 510560.SS | 512190.SS | 515190.SS | 516190.SS | 562390.SS | 513800.SS | 518680.SS | 159738.SZ | 159973.SZ |
|---|---|---|---|---|---|---|---|---|---|---|
| Max SR | 5 | 5 | 13 | 10 | 8 | 13 | 21 | 20 | 3 | 2 |
| Portfolio Composition (%) | 510270.SS | 510560.SS | 512190.SS | 512670.SS | 515190.SS | 515550.SS | 516100.SS | 562390.SS | 513800.SS | 513880.SS | 518600.SS | 518680.SS | 159898.SZ |
|---|---|---|---|---|---|---|---|---|---|---|---|---|---|
| Min Vol | 1 | 4 | 15 | 3 | 7 | 1 | 4 | 1 | 8 | 2 | 28 | 11 | 14 |
Return/Volatility scatter plot

2022-11-21 Updates
Data Preparation
Data source
Data cleaning
- In total we have 902 funds (620 from Shanghai, 282 from Shenzhen), including ETFs, LOFs, REITs, and etc.
- On yahoo finance, we can only get data of 818 funds.
- Only 664 of them has return data with less than 3 missing data points.
-
Funds with missingness more than 3 are deleted, while others are dealt with mean imputation.
- 我们共有902只基金(上海620只,深圳282只),包括ETF、LOF、REITs等。
- 在雅虎财金上,我们只能获取818只基金的数据。
- 其中只有664只的回报率数据缺失值少于3个。
- 缺失值数量超过3的基金被删除,而剩余缺失值则用均值填充。
Results Report
The portfolio that maximizes the Sharpe Ratio is consist of 10 funds (only these 10 have none zero weights after optimization), and the corresponding Sharpe Ratio is 19.19. For the portfolio that minimizes the Volatility is consist of 7 funds, and Sharpe Ratio is 6.40.
The fund with highest weight in both portfolio is 511360.SS (Hft Csi Short Term Note Etf). For more information, please look at the tables below.
使夏普比率最大化的投资组合(Max SR)由10只基金组成(优化后只有这10只基金是非零权重),对应的夏普比率为19.19。而最小化波动率的投资组合(Min Vol),由7只基金组成,夏普比率为6.40。
两个投资组合中权重最高的基金是511360.SS(海富通中证短融ETF)。更多信息,请见下表。
Background information
| Start Date | End Date | Risk Free Rate |
|---|---|---|
| 2022-10-21 | 2022-11-20 | 0.03 |
Portfolio information
| Portfolio | Sharpe Ratio | Returns (%) | Volatility (%) |
|---|---|---|---|
| Max SR | 19.19 | 9.02 | 0.47 |
| Min Vol | 6.40 | 1.28 | 0.2 |
Composition details
| Portfolio Composition (%) | 510270.SS | 511270.SS | 511310.SS | 511360.SS | 512190.SS | 513800.SS | 515190.SS | 562390.SS | 159649.SZ | 159913.SZ |
|---|---|---|---|---|---|---|---|---|---|---|
| Max SR | 2 | 16 | 15 | 45 | 3 | 1 | 2 | 2 | 11 | 1 |
| Portfolio Composition (%) | 510270.SS | 511010.SS | 511220.SS | 511360.SS | 512190.SS | 562390.SS | 159816.SZ |
|---|---|---|---|---|---|---|---|
| Min Vol | 2 | 16 | 3 | 70 | 1 | 1 | 5 |
Return/Volatility scatter plot

For coding details, see this github post.